Experimenting io_uring with Grafana Loki
tldr;
- Tried to integrate
io_uringusing https://github.com/pawelgaczynski/giouring into Grafana Loki when reading local filesystem for log chunks - Hope to see improvements from
io_uringwith benchmarks sync.Pool-ing buffers contributed to substantial performance benefits (due to fewer memory allocation)io_uringimplementation wasn’t better, most likely due to implementation and other factors- Received a few learnings from working on this
What I’m doing
Following through with my previous post on io_uring, I wanted to try using io_uring into the read path of Grafana Loki. Specifically, when reading log chunks from local filesystem files.
Using local filesystem to store log chunks is for simple deployments and not for production use cases, Grafana recommends object storage for production. I selected this use case to simply experiment.
Loki’s implementation
In object_client, GetChunks spins up multiple goroutines, and calls fs_object_client’s GetObject to fetch the log chunks from the filesystem. The implementation is simple, each chunk is stored in 1 file. When reading multiple log chunks, each file is read in its entirety with the stdlib file reader (i.e. the sync reader), decoded and returned.
Implementing io_uring_fs_client
My IOUringChunkClient implements GetChunks.
The io_uring instance was initialised with:
- size of 128
- SQPolling enabled
Because an io_uring instance is not thread safe, all interactions with it has to be done in the same goroutine. We reserve the main goroutine for this. To improve throughput (this was after some experimentation and profiling to identify bottlenecks), we spin up 3 other types of goroutines:
- To prepare the read requests. For each chunk, we have to
opena file, return its FD (file descriptor)- allocate a buffer for io_uring to write the contents to
- To poll the completion queue
- so that we can proceed to decode the buffer containing the chunk data read
- To decode the chunks read from file
- and notify the main goroutine for each chunk decoded
The 3 types of goroutine interacts with the main goroutine via channels. We return once once all chunks are decoded.
The code (including the benchmark tests).
- Due to the different message passing going on, the code is quite complex for the simple act of reading data (e.g. Now, I have to specify a buffer size)
The results
For the tests, we’ll compare the original implementation against the io_uring implementation when reading different no. of files/chunks and file/chunk sizes.
- Note that we’ll keep the Loki
syncreader implementation’smaxparrallelat the default of 150, i.e. 150 goroutines to fetch and decode - Raw benchmarks results
Against no. of files/chunks
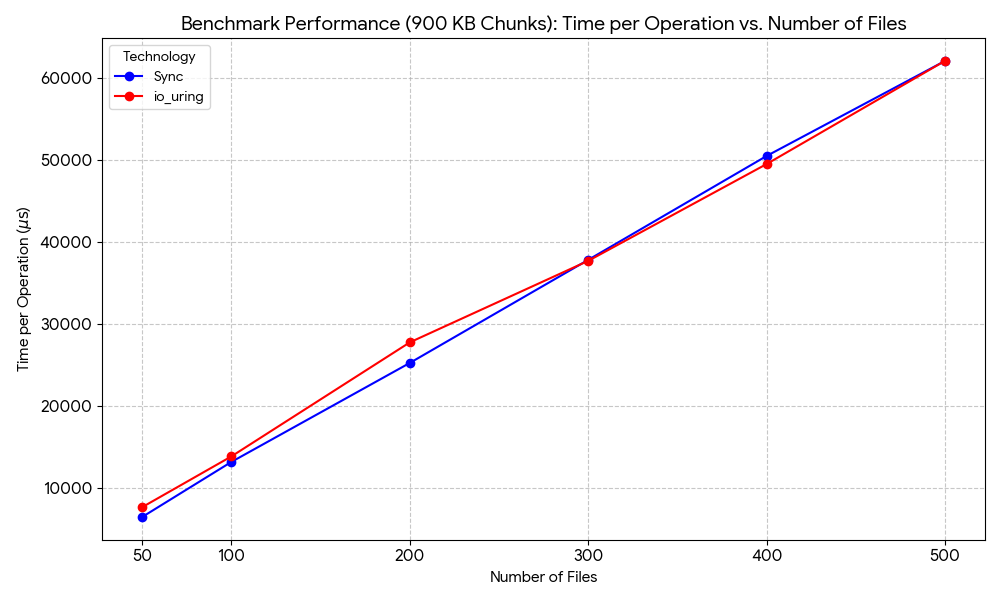
We can see that my io_uring implementation slightly underperforms sync read. Even though both converged at 300 files, but at > 300 files, there doesn’t seem to be a clear winner.
Against file/chunk sizes
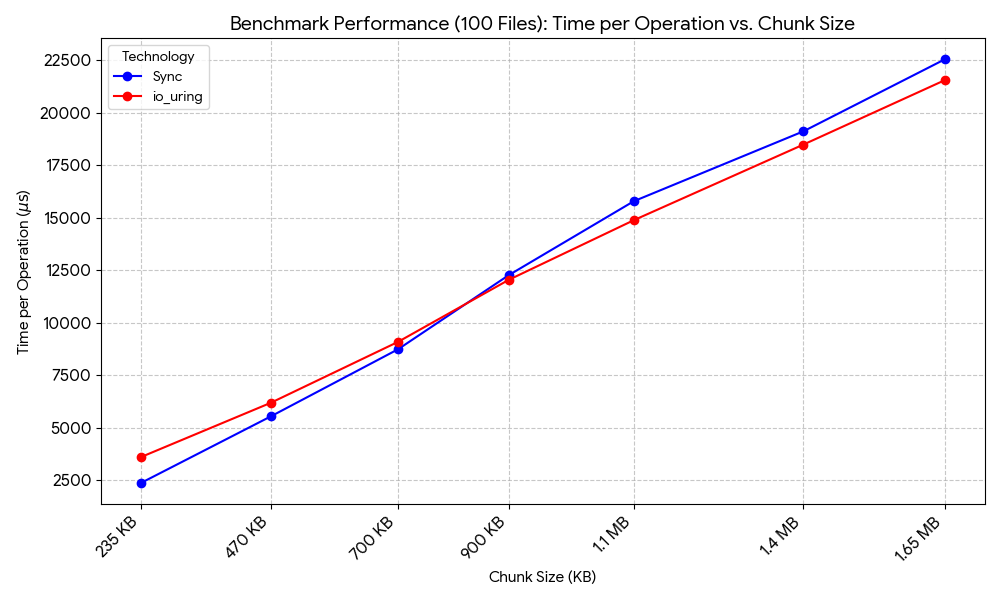
The results here are interesting. At smaller file/chunk sizes, sync outperforms io_uring, while io_uring outperforms at larger file/chunk sizes.
I ran the same tests with 200 files, and it seems like there’s a general trend where the io_uring outperforms at larger chunk sizes.
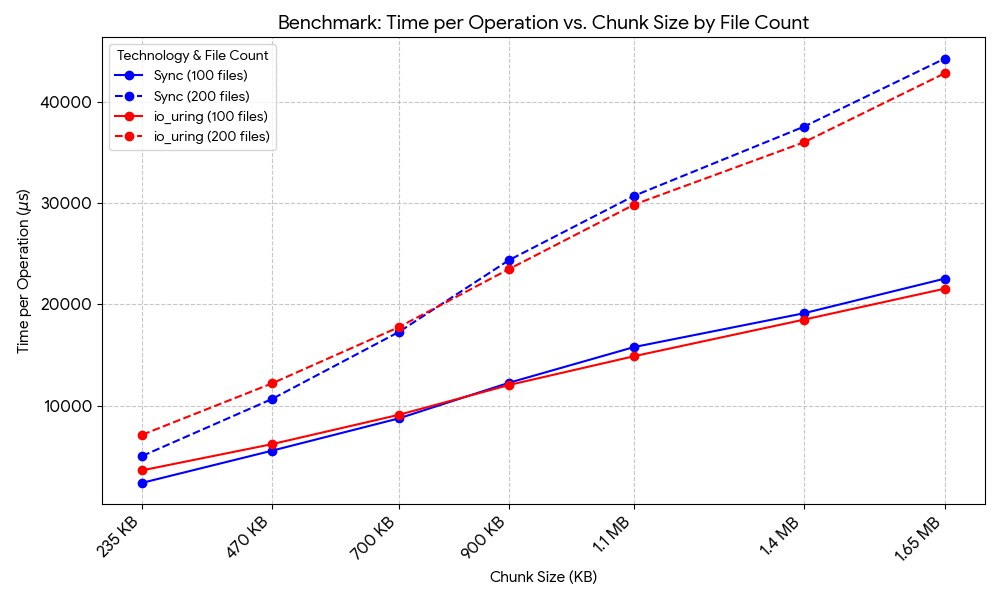
I have 2 guesses for this behaviour:
- With larger file sizes,
syncblocks compute from doing useful work more often, whileio_uringasync nature circumvents this. - Memory allocation becomes the difference here. We’re allocating much lesser in my
io_uringimplementation where I usesync.Poolto hold buffers while the originalsyncimplementation does not.
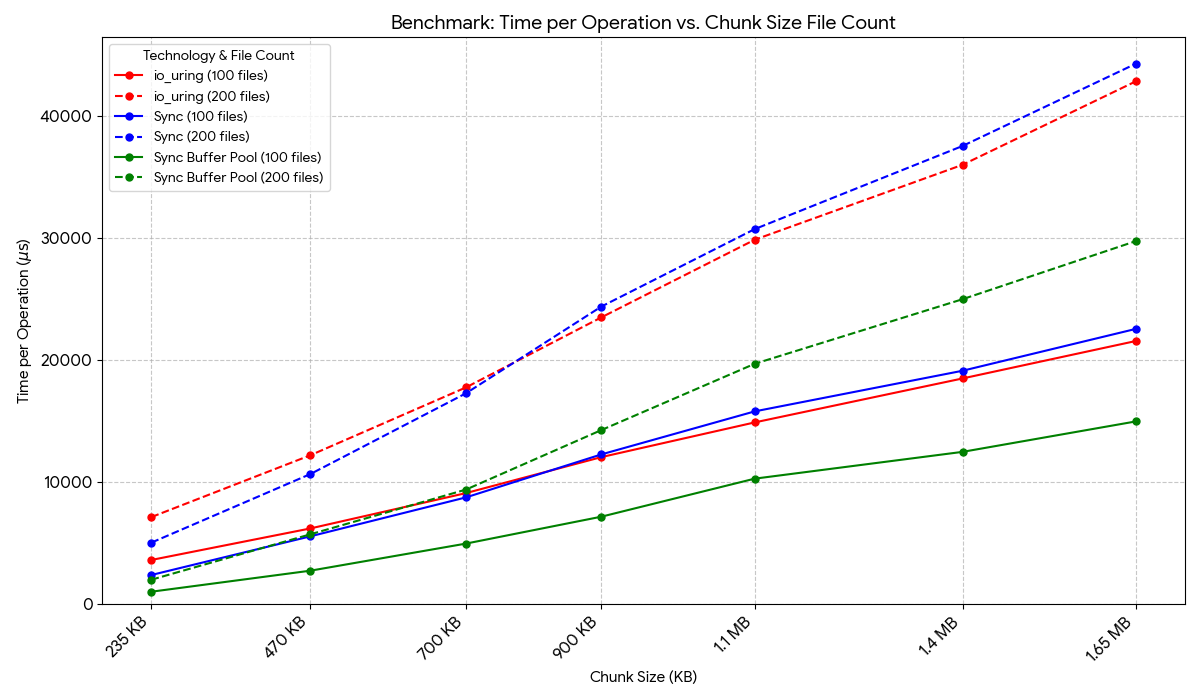
I decided to verify my 2nd hypothesis and I was right. I used a simple sync.Pool to hold the buffers used in sync reads, even over-allocating for smaller files. This is a substantial improvement. My io_uring implementation without buffer pooling would definitely have a poorer performance than the original sync implementation.
Summary
My IOUringChunkClient benchmarks fell short of expectations. There’s probably more factors that I’m missing here. e.g.
-
Maybe
io_uringperforms better with random reads across different files. In this experiement, we’re doing full sequential reads across files. -
Possibly, another hidden bottleneck in my implementation
Noting that qdrant’s experienced a speedup using io_uring. It’s worth noting where this experiment differed. Qdrant was:
- Comparing mmap with io_uring
- I was comparing against sync reads
- Issuing random disk reads
- I was doing full sequential read
- Using a network disk
- My tests used my local disk
Hurdles & learnings
Although the end result wasn’t what I hoped for (i.e. being able to see improvements with a simple io_uring implementation). One of the goals of doing this experiment was to expose myself to different issues and challenges that I don’t often have to encounter at work. Journaling these helps to solidify my learnings.
Broken io_uring library
Fortunately, I can use https://github.com/pawelgaczynski/giouring to integrate io_uring capabilities. It seeks to mimic liburing APIs but in Go. However, the library is unmaintained, and fails with go > 1.23. The library was previously hooking into Go’s internal symbol for mmap, and Go 1.23 disallow such uses.
The fix was to simply replace existing usage with the exported mmap provided by golang.org/x/sys/unix.
os.File/FDs are recycled once out of scope
io_uring’s Read SQE requires a FD to process the read. In initial iterations, I did something similar to this
for _, chunkFile := range chunks {
   f, _ := os.Open(chunkFile) // os.File holds the FD
   stats, _ := f.Stat()
   size := stats.Size()
   sqe = c.ring.GetSQE()
   sqe.PrepareRead(int(f.Fd()), bufPtr, size, 0)
   c.ring.Submit()
}
This is a buggy implementation. The reason is that the FD number used in sqe.PrepareRead has to persist for the same file when io_uring is processing it in the kernel after submission. However, Go’s GC gets in the way here. Once the os.File, f goes out of scope in the next iteration, it’s eligible to be garbage collected and the FD number can be reused for another chunk file. Because the kernel processes the submission async, when processing the SQE with the FD number, the same FD number may actually be pointing at another file.
e.g.
- FD number 6 was first assigned to chunk 1
- SQE is submitted with FD number 6
- Because of GC, FD number 6 is then reused for chunk 10
- Kernel starts processing the submitted SQE, reading from FD 6 pointing to chunk 10 instead of chunk 1
To work around this, I had to create a map to hold all opened os.File of the chunk files to prevent GC from reclaiming them
openedFiles := make([]*os.File, len(chunks)) // keep the open files, so their FDs don't get recycled because of GC
Re-using allocated objects with sync.Pool
Via this experiment, I also discovered sync.Pool, a nice and convenient primitive to reuse allocated and expensive-to-allocate objects. Loki uses this quite heavily in their code base.
I also used this to re-use allocated buffers for IOUringChunkClient when I realised that the buffer allocations took up quite some time.
Go profiling
I had to profile often while iterating on the implementation, so I wanted to highlight some learnings.
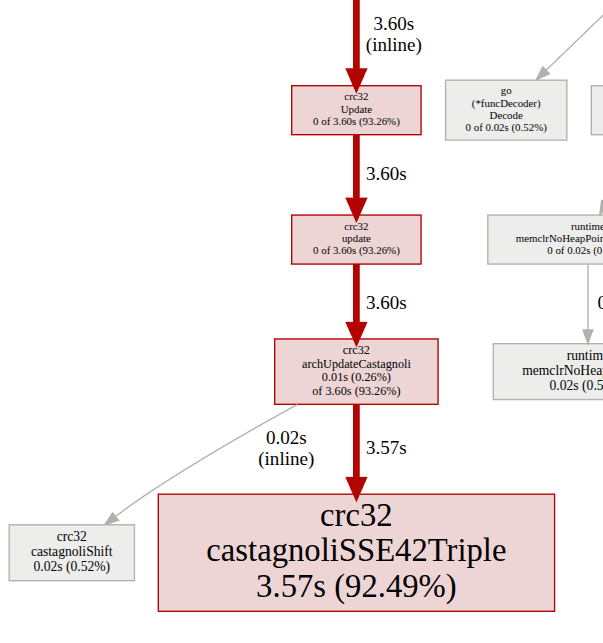
In the profile below, we can see that hash/crc32.archUpdateCastagnoli has a cum of 3.60s but a flat of 0.01s. This means that most of the time is taken by a child function.
$ go tool pprof pkg/storage/chunk/client/local/iouring.prof
File: local.test
Build ID: 9cd336497da4ec752f0a2940918b5d395a30df9a
Type: cpu
Time: 2025-10-20 21:03:12 +08
Duration: 1.41s, Total samples = 3.86s (274.63%)
Entering interactive mode (type "help" for commands, "o" for options)
(pprof) top10
Showing nodes accounting for 3.68s, 95.34% of 3.86s total
Dropped 80 nodes (cum <= 0.02s)
Showing top 10 nodes out of 54
      flat  flat%   sum%        cum   cum%
     3.57s 92.49% 92.49%      3.57s 92.49%  hash/crc32.castagnoliSSE42Triple
     0.02s  0.52% 93.01%      0.02s  0.52%  hash/crc32.castagnoliShift (inline)
     0.02s  0.52% 93.52%      0.02s  0.52%  runtime.(*mheap).alloc.func1
     0.02s  0.52% 94.04%      0.02s  0.52%  runtime.(*spanSet).push
     0.02s  0.52% 94.56%      0.02s  0.52%  runtime.memclrNoHeapPointers
     0.01s  0.26% 94.82%      3.60s 93.26%  hash/crc32.archUpdateCastagnoli
     0.01s  0.26% 95.08%      0.02s  0.52%  internal/poll.(*FD).Init
     0.01s  0.26% 95.34%      0.02s  0.52%  strconv.genericFtoa
         0     0% 95.34%      0.02s  0.52%  fmt.(*pp).doPrintf
         0     0% 95.34%      0.02s  0.52%  fmt.(*pp).handleMethods
The child function is be confirmed to be hash/crc32.castagnoliSSE42Triple via the callgraph and is responsible for most of the CPU time on its own (i.e. its cum == flat)
sum% is purely the cumulative total of that line and all the line above it. E.g. the the 3rd line’s 93.52% = 92.49% + 0.52% + 0.52%
My kernel version
Since this affects io_uring,
$ uname -r
6.8.0-85-generic